GLM Field of View Edges#
GLM FOV edges from a file obtained from Katrina Virts and Scott Rudlosky in an email January 4, 2021. These are the FOV edges used in the paper Initial Geostationary Lightning Mapper Observations (Rudlosky et al. 2018)
Hi Brian,
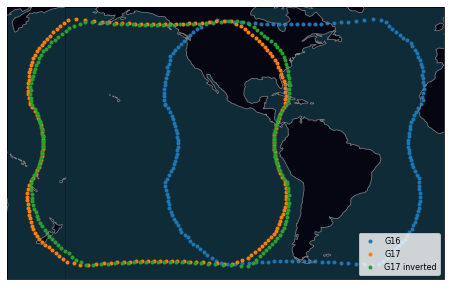
The attached file contains nominal FOV boundaries for GLM-16 when in test position (the first ~6 months after launch) and in GOES-East position at -75.2W, and for GLM-17 in GOES-West position at -137.2W in normal and inverted orientations. As Scott mentioned, GOES-17 undergoes biannual yaw flips. In the figure he attached, the solid (dashed) line depicts coverage during boreal summer (winter) when GLM-17 is in normal (inverted) orientation.
Please let me know if you have any questions. Thanks!
Katrina
Contact them if you need the exact edges of the GLM FOV. Otherwise, the estimated boundary I derive here (patterned after glmtools) is pretty close.
[1]:
import xarray as xr
import matplotlib.pyplot as plt
import cartopy.crs as ccrs
from BB_maps.add_to_cartopy import common_features, pc

# this just needed to display facecolor as transparent in this notebook...
import matplotlib as mpl
mpl.rcParams['figure.facecolor'] = 'w'
%config InlineBackend.print_figure_kwargs={'facecolor' : 'none'}
WARNING! No module named 'dask'
Without dask, you cannot use dask for multiprocessing.
/p/home/blaylock/BB_python/Carpenter_Workshop/toolbox/cartopy_tools.py:33: UserWarning: No module named 'geopandas' Without geopandas, you cannot subset some NaturalEarthFeatures, like "Major Highways" from roads.
  warnings.warn(
[2]:
g = xr.open_dataset('GLM_FOV_edges.nc')
[3]:
g
[3]:
<xarray.Dataset>
Dimensions:               (1: 1, n16: 3844, n17: 3848)
Dimensions without coordinates: 1, n16, n17
Data variables:
    G16_fov_lat           (1, n16) float64 17.64 17.56 17.47 ... 17.81 17.72
    G16_fov_lon           (1, n16) float64 -134.2 -134.2 ... -134.2 -134.1
    test_fov_lat          (1, n16) float64 17.64 17.56 17.47 ... 17.81 17.72
    test_fov_lon          (1, n16) float64 -148.5 -148.5 ... -148.5 -148.4
    G17_fov_lat           (1, n17) float64 18.16 18.07 17.98 ... 18.32 18.24
    G17_fov_lon           (1, n17) float64 -196.5 -196.4 ... -196.5 -196.4
    G17_fov_lat_inverted  (1, n17) float64 -18.14 -18.05 ... -18.31 -18.22
    G17_fov_lon_inverted  (1, n17) float64 -77.92 -77.99 ... -77.96 -78.03
Attributes:
    summary:  Nominal latitude/longitude edges of GLM FOV
source: Prepared by Katrina Virts (NASA/MSFC; katrina.virts@uah.edu) ba...- 1: 1
- n16: 3844
- n17: 3848
- G16_fov_lat(1, n16)float64...
- long_name :
- Latitude coordinates for GLM-16 FOV when in GOES-East position
- units :
- degrees_north
- nominal_satellite_subpoint_lat :
- 0.0
- nominal_satellite_subpoint_lon :
- -75.2
array([[17.644459, 17.556558, 17.468767, ..., 17.900494, 17.812331, 17.724281]])
- G16_fov_lon(1, n16)float64...
- long_name :
- Longitude coordinates for GLM-16 FOV when in GOES-East position
- units :
- degrees_east
- nominal_satellite_subpoint_lat :
- 0.0
- nominal_satellite_subpoint_lon :
- -75.2
array([[-134.228736, -134.161731, -134.095371, ..., -134.254497, -134.186218, -134.1186 ]]) - test_fov_lat(1, n16)float64...
- long_name :
- Latitude coordinates for GLM-16 FOV when in test position
- units :
- degrees_north
- nominal_satellite_subpoint_lat :
- 0.0
- nominal_satellite_subpoint_lon :
- -89.5
array([[17.644459, 17.556558, 17.468767, ..., 17.900494, 17.812331, 17.724281]])
- test_fov_lon(1, n16)float64...
- long_name :
- Longitude coordinates for GLM-16 FOV when in test position
- units :
- degrees_east
- nominal_satellite_subpoint_lat :
- 0.0
- nominal_satellite_subpoint_lon :
- -89.5
array([[-148.528736, -148.461731, -148.395371, ..., -148.554497, -148.486218, -148.4186 ]]) - G17_fov_lat(1, n17)float64...
- long_name :
- Latitude coordinates for GLM-17 FOV when in GOES-West position
- units :
- degrees_north
- nominal_satellite_subpoint_lat :
- 0.0
- nominal_satellite_subpoint_lon :
- -137.2
array([[18.155981, 18.06748 , 17.979095, ..., 18.413404, 18.324627, 18.235969]])
- G17_fov_lon(1, n17)float64...
- long_name :
- Longitude coordinates for GLM-17 FOV when in GOES-West position
- units :
- degrees_east
- nominal_satellite_subpoint_lat :
- 0.0
- nominal_satellite_subpoint_lon :
- -137.2
array([[-196.503294, -196.433109, -196.363612, ..., -196.535653, -196.464119, -196.39329 ]]) - G17_fov_lat_inverted(1, n17)float64...
- long_name :
- Latitude coordinates for GLM-17 FOV when in inverted GOES-West position
- units :
- degrees_north
- nominal_satellite_subpoint_lat :
- 0.0
- nominal_satellite_subpoint_lon :
- -137.2
array([[-18.141525, -18.053037, -17.964666, ..., -18.39892 , -18.310156, -18.221511]]) - G17_fov_lon_inverted(1, n17)float64...
- long_name :
- Longitude coordinates for GLM-17 FOV when in inverted GOES-West position
- units :
- degrees_east
- nominal_satellite_subpoint_lat :
- 0.0
- nominal_satellite_subpoint_lon :
- -137.2
array([[-77.923579, -77.993666, -78.063067, ..., -77.891327, -77.96276 ,
        -78.033492]])
- summary :
- Nominal latitude/longitude edges of GLM FOV
- source :
- Prepared by Katrina Virts (NASA/MSFC; katrina.virts@uah.edu) based on information from Doug Mach and Clem Tillier
[6]:
ax = common_features(crs=ccrs.PlateCarree(central_longitude=-100),
                     OCEAN=True, dark=True, figsize=[10,5])
kwargs = dict(transform=pc, marker='.')
thin = 20
ax.scatter(g.G16_fov_lon.thin(thin), g.G16_fov_lat.thin(thin), label='G16', **kwargs)
ax.scatter(g.G17_fov_lon.thin(thin), g.G17_fov_lat.thin(thin), label='G17', **kwargs)
ax.scatter(g.G17_fov_lon_inverted.thin(thin), g.G17_fov_lat_inverted.thin(thin), label='G17 inverted', **kwargs)
plt.legend(fontsize=8, loc=4)
[6]:
<matplotlib.legend.Legend at 0x2b19e2cfbd30>
How is this edge different than my estimated boundary in goes2go.tools.field_of_view?#
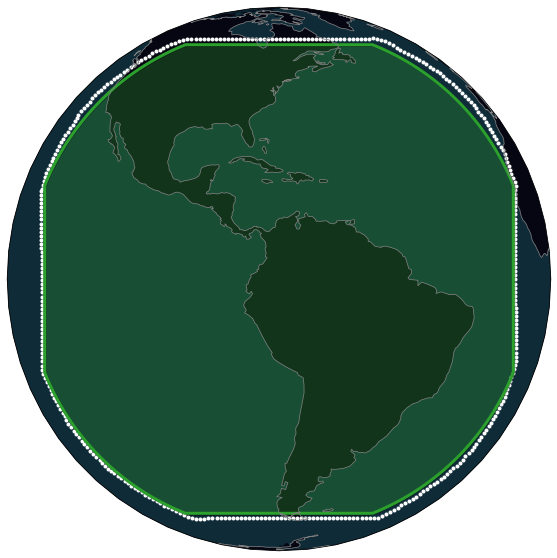
GOES-East#
[7]:
from goes2go.data import goes_latest
[8]:
# Get a sample GLM file
glm = goes_latest(satellite=16, product='GLM')
 _______________________________
 | Satellite: noaa-goes16      |
 |   Product: GLM-L2-LCFA      |
📦 Finished downloading [1] files to [/p/cwfs/blaylock/data/noaa-goes16/GLM-L2-LCFA].
📚 Finished reading [1] files into xarray.Dataset.
[10]:
ax = common_features(crs=glm.FOV.crs, figsize=[10,10],
                     dark=True, OCEAN=True)

# Plot estimated GLM field-of-view
ax.add_geometries([glm.FOV.full_disk], crs=glm.FOV.crs,
                   facecolor='tab:green', edgecolor='k', alpha=0.3, linewidth=3)
ax.add_geometries([glm.FOV.full_disk], crs=glm.FOV.crs,
                   facecolor='none', edgecolor='tab:green', alpha=1, linewidth=3)

# Plot the actual GLM FOV from Katrina
thin=10
ax.scatter(g.G16_fov_lon.thin(thin),
           g.G16_fov_lat.thin(thin),
           color='w', label='G16', **kwargs)

ax.set_global()
How does that look on a rectangular grid?
[11]:
ax = common_features(crs=pc, figsize=[10,10],
                     dark=True, OCEAN=True)
ax.add_geometries([glm.FOV.full_disk], crs=glm.FOV.crs,
                   facecolor='tab:green', edgecolor='k', alpha=0.3, linewidth=3)
ax.add_geometries([glm.FOV.full_disk], crs=glm.FOV.crs,
                   facecolor='none', edgecolor='tab:green', alpha=1, linewidth=3)

thin=10
ax.scatter(g.G16_fov_lon.thin(thin),
           g.G16_fov_lat.thin(thin),
           color='w', label='G16', **kwargs)
[11]:
<matplotlib.collections.PathCollection at 0x2b1a2be14fa0>
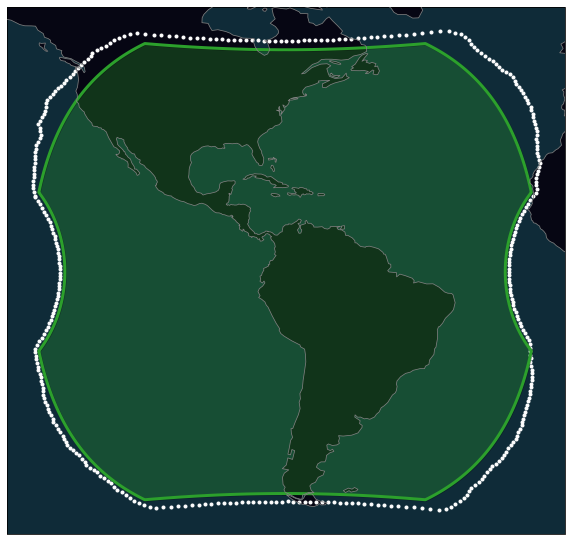
My estimated FOV based on the instrument specs does pretty good to mimic the actual GLM FOV, except for the curved corners. I’m not sure why–must be instrument design.
[ ]:
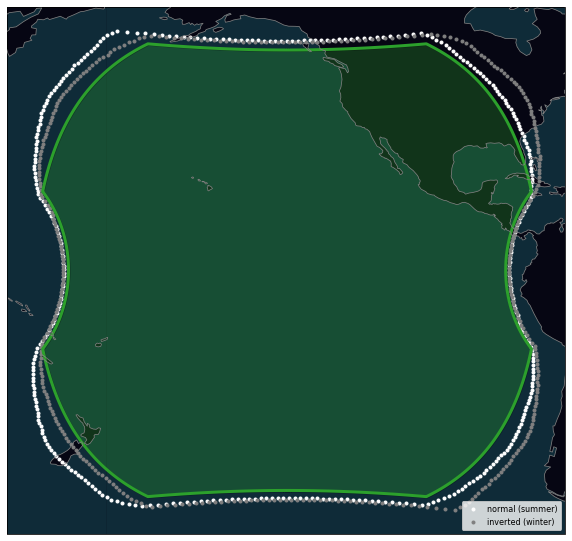
GOES-West#
A yaw flip changes the boundary for GOES-17 twice a year
[14]:
# Get a sample GLM file
glm = goes_latest(satellite=17, product='GLM')

ax = common_features(crs=ccrs.PlateCarree(central_longitude=-100), figsize=[10,10],
                     dark=True, OCEAN=True)
ax.add_geometries([glm.FOV.full_disk], crs=glm.FOV.crs,
                   facecolor='tab:green', edgecolor='k', alpha=0.3, linewidth=3)
ax.add_geometries([glm.FOV.full_disk], crs=glm.FOV.crs,
                   facecolor='none', edgecolor='tab:green', alpha=1, linewidth=3)

thin=10
ax.scatter(g.G17_fov_lon.thin(thin),
           g.G17_fov_lat.thin(thin),
           color='w', label='normal (summer)', **kwargs)

ax.scatter(g.G17_fov_lon_inverted.thin(thin),
           g.G17_fov_lat_inverted.thin(thin),
           color='.5', label='inverted (winter)', **kwargs)
plt.legend(loc=4, fontsize=8)
 _______________________________
 | Satellite: noaa-goes17      |
 |   Product: GLM-L2-LCFA      |
📦 Finished downloading [1] files to [/p/cwfs/blaylock/data/noaa-goes17/GLM-L2-LCFA].
📚 Finished reading [1] files into xarray.Dataset.
[14]:
<matplotlib.legend.Legend at 0x2b1a2bef0f70>
[ ]: