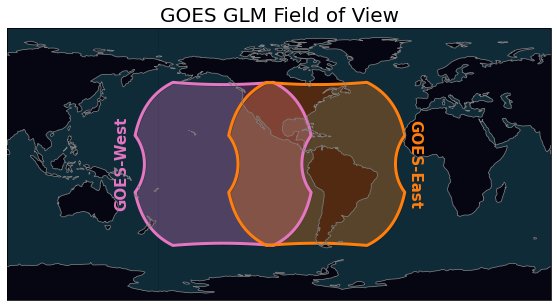
⚡ GLM Geostationary field-of-view in Cartopy#
Based on information from glmtools
-
Lens field of view = +/- 8 degrees (16-degree field of view) (pg 57, 225).
Ground sample distance = 8 - 14 km (pg 225).
Background Image from GLM (Fig. 4-12, pg 69).
Focal Plane is subdivided into 56 physical regions or subarrays, 49 pixels tall by 650 pixels wide (Fig. 4-13, pg 70).
GLM field-of-view shown in Fig 4-3 (pg 59).
From glmtools > The GLM full-disk (minimum spec) is defined as the intersection of circular and square Earth-centered fields-of-view having minimum diameter 15.59° and minimum length 14.81° respectively. It seems that 16 and 15 deg, respectively, better matches Fig. 4-3 in the GOES data book.
[1]:
from datetime import datetime
import cartopy.crs as ccrs
import matplotlib.pyplot as plt
from shapely.geometry import Point
import numpy as np

from goes2go.data import goes_latest, goes_nearesttime

from BB_maps.add_to_cartopy import common_features, pc
WARNING! No module named 'dask'
Without dask, you cannot use dask for multiprocessing.
/p/home/blaylock/BB_python/Carpenter_Workshop/toolbox/cartopy_tools.py:33: UserWarning: No module named 'geopandas' Without geopandas, you cannot subset some NaturalEarthFeatures, like "Major Highways" from roads.
  warnings.warn(
[2]:
g16 = goes_latest(satellite='G16', product='GLM')
g17 = goes_latest(satellite='G17', product='GLM')
 _______________________________
 | Satellite: noaa-goes16      |
 |   Product: GLM-L2-LCFA      |
📦 Finished downloading [1] files to [/p/cwfs/blaylock/data/noaa-goes16/GLM-L2-LCFA].
📚 Finished reading [1] files into xarray.Dataset.
 _______________________________
 | Satellite: noaa-goes17      |
 |   Product: GLM-L2-LCFA      |
📦 Finished downloading [1] files to [/p/cwfs/blaylock/data/noaa-goes17/GLM-L2-LCFA].
📚 Finished reading [1] files into xarray.Dataset.
Get the data’s coordinate reference system and field of view with the goes2go.tools.field_of_view function#
This returns both the field of view as a shapely polygon and the cartopy coordinate reference system.
[3]:
g16.FOV.full_disk
[3]:

[4]:
g16.FOV.crs # This is the cartopy crs
[4]:
<cartopy.crs.Geostationary object at 0x2ab6529746d0>
[20]:
ax = common_features(OCEAN=True, LAND=True,
                     crs=ccrs.PlateCarree(central_longitude=-100),
                     figsize=[10,5],
                     dark=True)

# Draw boundary of GOES17
ax.add_geometries([g17.FOV.full_disk], crs=g17.FOV.crs,
                   facecolor='tab:pink', edgecolor='k', alpha=0.3, linewidth=3)
ax.add_geometries([g17.FOV.full_disk], crs=g17.FOV.crs,
                   facecolor='none', edgecolor='tab:pink', alpha=1, linewidth=3, zorder=10)

# Draw boundary of GOES16
ax.add_geometries([g16.FOV.full_disk], crs=g16.FOV.crs,
                   facecolor='tab:orange', edgecolor='k', alpha=0.3, linewidth=3)
ax.add_geometries([g16.FOV.full_disk], crs=g16.FOV.crs,
                   facecolor='none', edgecolor='tab:orange', alpha=1, linewidth=3, zorder=10)

ax.text(g17.lon_field_of_view-72,
        g17.lat_field_of_view,
        'GOES-West', transform=pc,
       rotation=90, va='center', fontsize=15, color='tab:pink', fontweight='bold')

ax.text(g16.lon_field_of_view+60,
        g16.lat_field_of_view,
        'GOES-East', transform=pc,
       rotation=-90, va='center', fontsize=15, color='tab:orange', fontweight='bold')

plt.title('GOES GLM Field of View', fontsize=20)

plt.savefig('../images/GLM_field-of-view.png')
plt.savefig('../docs/_static/GLM_field-of-view.png')
[7]:
geo16.proj4_params, geo17.proj4_params
[7]:
({'a': 6378137.0,
  'b': 6356752.31414,
  'rf': 298.2572221,
  'proj': 'geos',
  'lon_0': -75.0,
  'lat_0': 0.0,
  'h': 35786023.4375,
  'x_0': 0,
  'y_0': 0,
  'units': 'm',
  'sweep': 'x'},
 {'a': 6378137.0,
  'b': 6356752.31414,
  'rf': 298.2572221,
  'proj': 'geos',
  'lon_0': -137.0,
  'lat_0': 0.0,
  'h': 35786023.4375,
  'x_0': 0,
  'y_0': 0,
  'units': 'm',
  'sweep': 'x'})
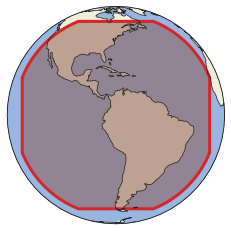
You will notice that the GLM field of view is smaller than the ABI field of view, which can see the full disk.#
[17]:
ax = common_features(crs=g16.FOV.crs, LAND=True, OCEAN=True)
ax.add_geometries([g16.FOV.full_disk], crs=g16.FOV.crs, alpha=.5, color='tab:brown')
ax.add_geometries([g16.FOV.full_disk], crs=g16.FOV.crs, edgecolor='tab:red', lw=3,  facecolor='none')
[17]:
<cartopy.mpl.feature_artist.FeatureArtist at 0x2ab7faa13640>
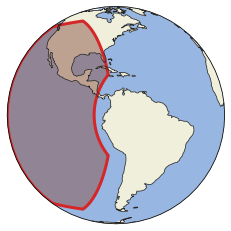
What is the overlap from GOES West, as viewed from GOES East?#
[19]:
ax = common_features(crs=g16.FOV.crs, LAND=True, OCEAN=True)
ax.add_geometries([g17.FOV.full_disk], crs=g17.FOV.crs, alpha=.5, color='tab:brown')
ax.add_geometries([g17.FOV.full_disk], crs=g17.FOV.crs, edgecolor='tab:red', lw=3,  facecolor='none')
[19]:
<cartopy.mpl.feature_artist.FeatureArtist at 0x2ab7fab10940>
Why isn’t the GLM field of view circular? Why are there notches in the sides?#
The GLM’s documented field of view is +/- 8 degrees from its view at nadir. However, in the official documents, the GLM field of view is shown to have a boundary that is not circular, as shown in the GOES-R Data Book.

The field of view cuts off the top, bottom, left, and right sides of that view. The cutoff sides are evident from a raw image from the GLM instrument from the GOES-R Data Book. Note: This photo was taken when GOES was in the “GOES-central” test position.

The only place I have found this mentioned is in this glmtools notebook. It claims the square boundary is 15 degrees; just a little smaller than its 16 degree field of view. I used the same general method to trim off these boundaries.
Below will recreate an approximate boundary for the GLM picture in the “GOES-Central” position, when nadir was -89.5 longitude.
[10]:
from shapely.geometry import Point, Polygon

sat_h = 35786023
nadir_lon = -89.5
nadir_lat = 0

resolution = 60

crs_central = ccrs.Geostationary(central_longitude=nadir_lon,
                                 satellite_height=sat_h)
[11]:
# create the circular field of view
FOV_radius_circle = np.radians(16/2) * sat_h
FOV_circle = Point(0,0).buffer(FOV_radius_circle,
                               resolution=resolution)
FOV_circle
[11]:

[12]:
# create the square field of view
# this is more than just the corner points
FOV_radius_square = np.radians(15/2) * sat_h
# Create a square with many points clockwise, starting in bottom left corner
side1x, side1y = np.ones(resolution)*-FOV_radius_square, np.linspace(-FOV_radius_square, FOV_radius_square, resolution),
side2x, side2y = np.linspace(-FOV_radius_square, FOV_radius_square, resolution), np.ones(resolution)*FOV_radius_square
side3x, side3y = np.ones(resolution)*FOV_radius_square, np.linspace(FOV_radius_square, -FOV_radius_square, resolution),
side4x, side4y = np.linspace(FOV_radius_square, -FOV_radius_square, resolution), np.ones(resolution)*-FOV_radius_square
x = np.hstack([side1x, side2x, side3x, side4x])
y = np.hstack([side1y, side2y, side3y, side4y])
FOV_square = Polygon(zip(x,y))
FOV_square
[12]:

Now take the intersection of the two shapes, and that is the GLM field of view
[13]:
final_FOV = FOV_circle.intersection(FOV_square)
final_FOV
[13]:

[14]:
# Plotted on a cartopy map
ax = common_features(projection=crs_central, LAND=True, OCEAN=True, figsize=[10,10])
ax.add_geometries([FOV_circle], crs=crs_central, alpha=.4, color='blue', hatch='/')
ax.add_geometries([FOV_square], crs=crs_central, alpha=.4, color='green', hatch='\\')

ax.add_geometries([final_FOV], crs=crs_central,
                  facecolor='none', edgecolor='k', linewidth=5)
[14]:
<cartopy.mpl.feature_artist.FeatureArtist at 0x2af90e1f4bd0>
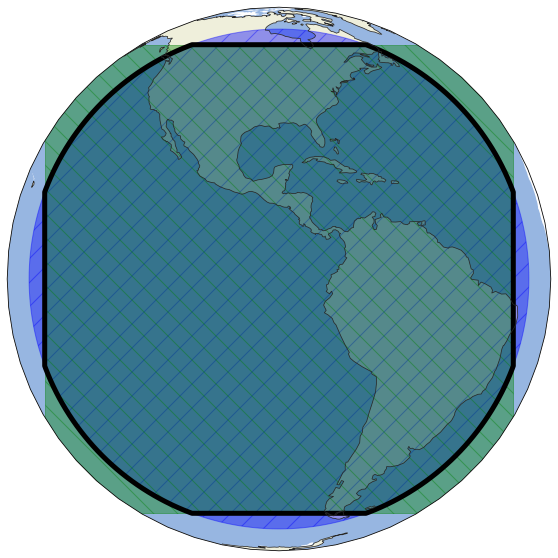
This looks pretty close to the raw GLM image. There is some waveness along the boundary in the raw image and also evident in the plots by Rudlosky et al. 2018, but I’m not sure how to derive those or why those exist. It must be related to the instrument’s design.


An email from Rudlosky showed me the real edges for the GLM FOV (notice the GOES-17 edges has two boundaries, one for the yaw flip)

[ ]: