Cartopy
adjustable axes, ‘box’ or ‘datalim’
fig, axes = plt.subplots(1, 2, subplot_kw=dict(projection=pc, adjustable='datalim'))
for ax in axes:
    ax.coastlines()

# Default behavior is "box"
fig, axes = plt.subplots(1, 2, subplot_kw=dict(projection=pc, adjustable='box'))
for ax in axes:
    ax.coastlines()

Different projection for each subplot
import matplotlib.pyplot as plt
import cartopy.crs as ccrs
plt.figure(figsize=[16, 8])
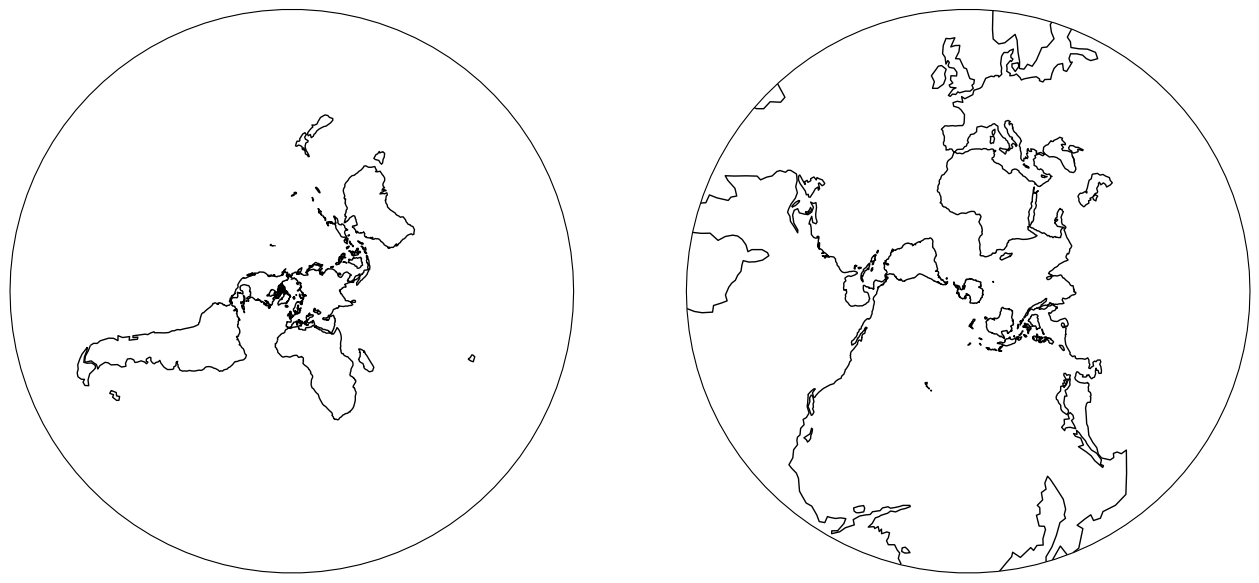
ax1 = plt.subplot(121, projection=ccrs.NorthPolarStereo())
ax2 = plt.subplot(122, projection=ccrs.SouthPolarStereo())
ax1.coastlines()
ax2.coastlines()
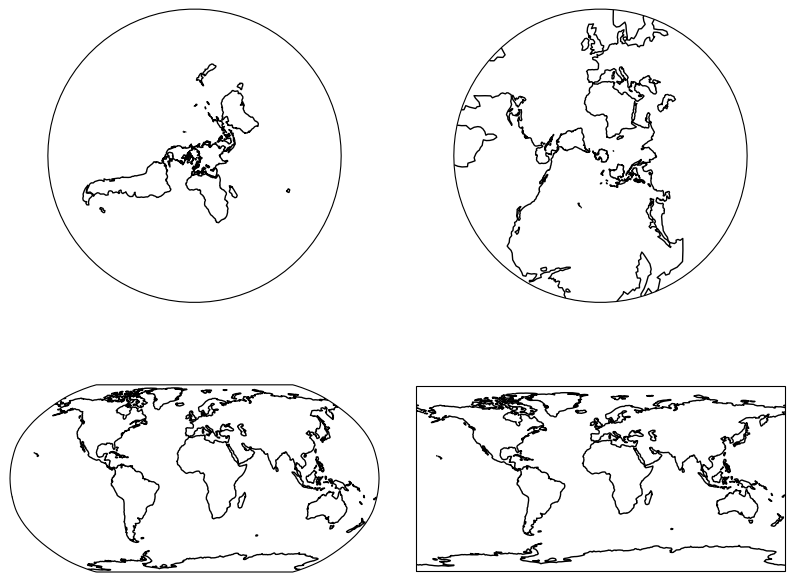
plt.figure(figsize=[10, 8])
ax1 = plt.subplot(221, projection=ccrs.NorthPolarStereo())
ax2 = plt.subplot(222, projection=ccrs.SouthPolarStereo())
ax3 = plt.subplot(223, projection=ccrs.Robinson())
ax4 = plt.subplot(224, projection=ccrs.PlateCarree())

ax1.coastlines()
ax2.coastlines()
ax3.coastlines()
ax4.coastlines()

plt.subplots_adjust(hspace=0.1, wspace=0.1)
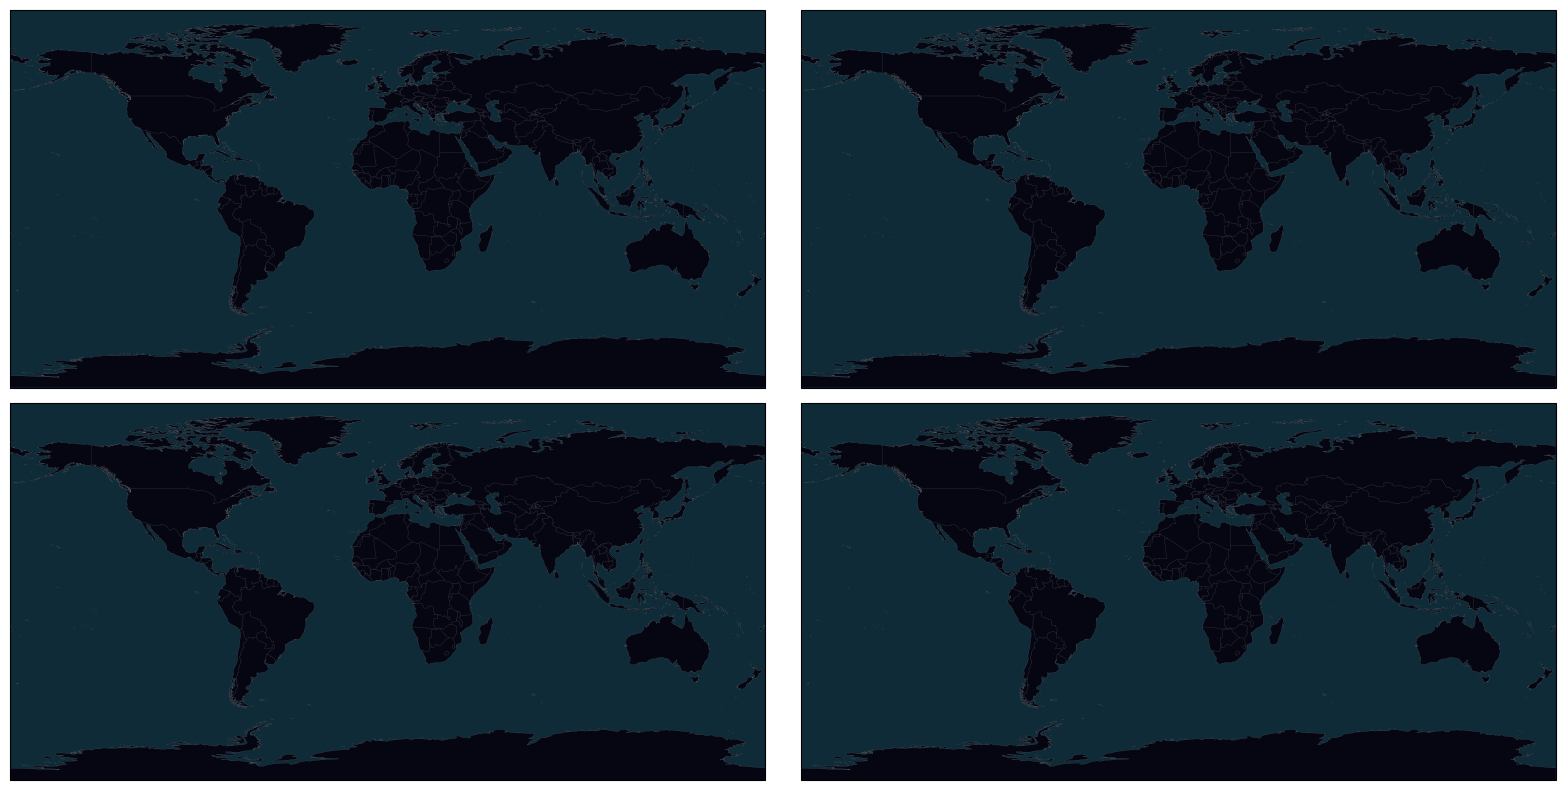
Dark Theme Map
import cartopy.crs as ccrs
import cartopy.feature as cfeature

plt.figure(figsize=[16, 8])
ax1 = plt.subplot(221, projection=ccrs.PlateCarree())
ax2 = plt.subplot(222, projection=ccrs.PlateCarree())
ax3 = plt.subplot(223, projection=ccrs.PlateCarree())
ax4 = plt.subplot(224, projection=ccrs.PlateCarree())
axes = (ax1, ax2, ax3, ax4)

for ax in axes:
    ax.set_global()
    ax.add_feature(cfeature.LAND.with_scale("50m"), facecolor="#060613")
    # ax.add_feature(cfeature.OCEAN.with_scale("50m"), facecolor="#0f2b38")
    ax.set_facecolor("#0f2b38")  # OCEAN color
    ax.add_feature(
        cfeature.COASTLINE.with_scale("50m"),
        zorder=1000,
        facecolor="none",
        linewidth=0.1,
        edgecolor="0.5",
    )
    ax.add_feature(
        cfeature.BORDERS.with_scale("50m"),
        zorder=1000,
        facecolor="none",
        linewidth=0.1,
        edgecolor="0.5",
    )


plt.tight_layout()